
问题标题
如何自定义Tooltip形状?
问题描述
Vchart的tooltip前面的形状有办法自定义吗?
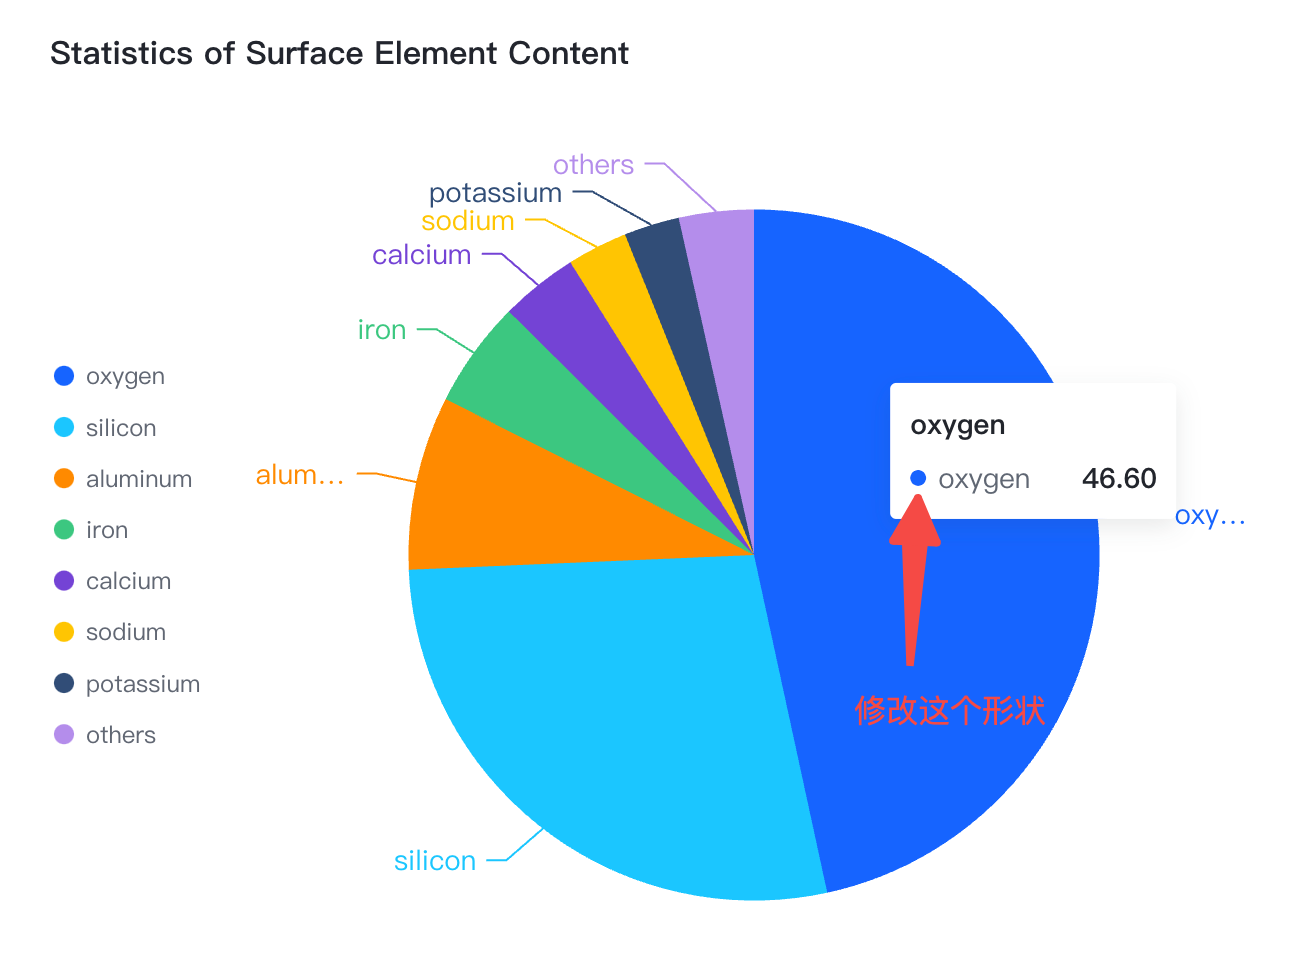
解决方案
vchart的Spec中有tooltip相关的配置,配置tooltip属性即可。tooltip的mark属性表示hover到图元上的效果https://visactor.io/vchart/option/pieChart#tooltip.mark。mark.content表示内容�的配置,在mark.content中配置shapeType字段就可以
代码示例
const spec = {
type: 'pie',
data: [
{
id: 'id0',
values: [
{ type: 'oxygen', value: '46.60' },
{ type: 'silicon', value: '27.72' },
{ type: 'aluminum', value: '8.13' },
{ type: 'iron', value: '5' },
{ type: 'calcium', value: '3.63' },
{ type: 'sodium', value: '2.83' },
{ type: 'potassium', value: '2.59' },
{ type: 'others', value: '3.5' }
]
}
],
tooltip: {
mark:
{
content: {
key: datum => datum['type'],
value: datum => datum['value'] + '%',
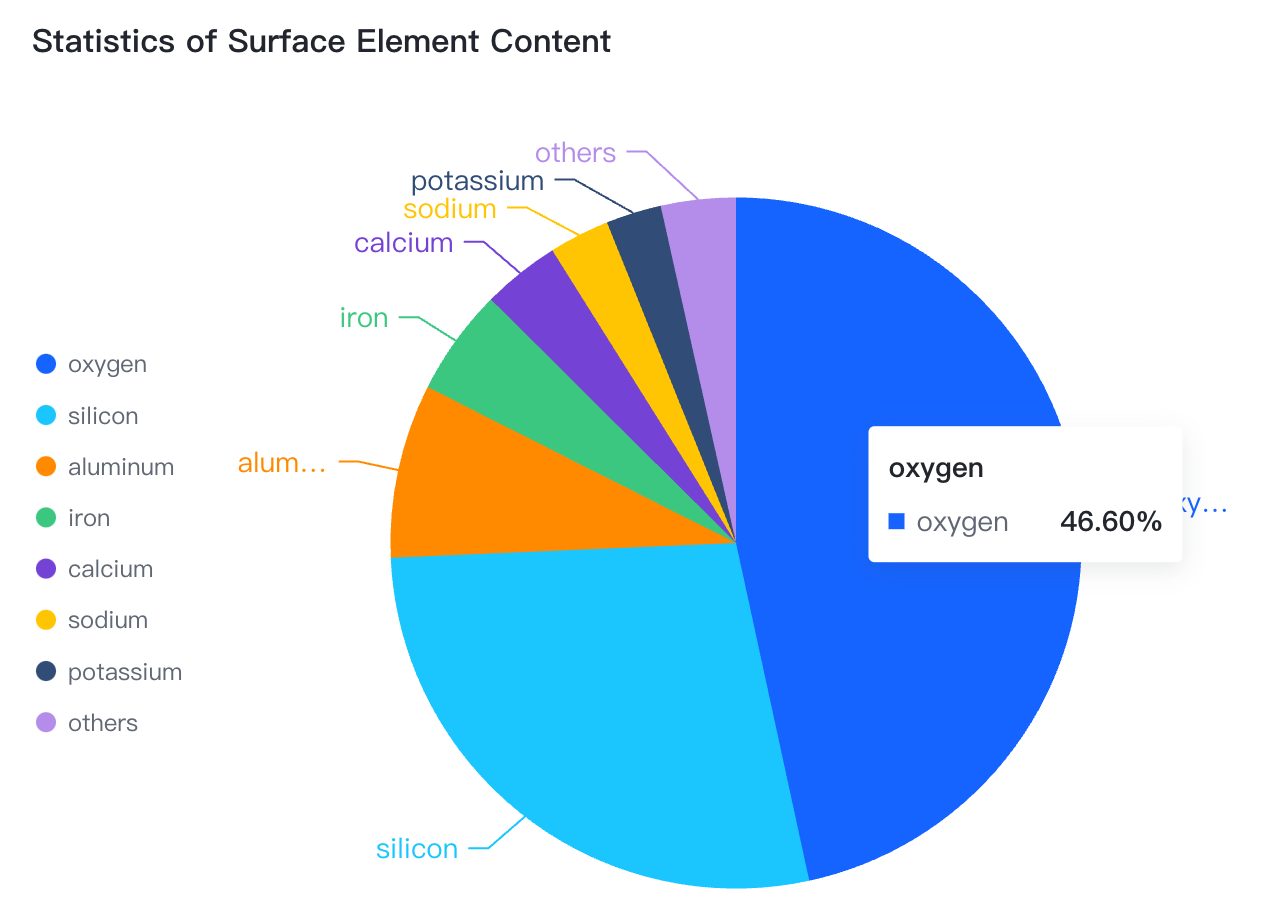
shapeType: 'square'
}
},
},
outerRadius: 0.8,
valueField: 'value',
categoryField: 'type',
title: {
visible: true,
text: 'Statistics of Surface Element Content'
},
legends: {
visible: true,
orient: 'left'
},
label: {
visible: true
}
};
const vchart = new VChart(spec, { dom: CONTAINER_ID });
vchart.renderSync();
// Just for the convenience of console debugging, DO NOT COPY!
window['vchart'] = vchart;</br>
结果展示
代码运行后,tooltip的symbol就变成了矩形
在线demo:https://codesandbox.io/p/sandbox/tooltip-shape-cdzny7?file=%2Fsrc%2Findex.ts%3A44%2C2
相关文档
- VChart 的官网:https://visactor.io/vchart/
- VChart的tooltip配置:https://visactor.io/vchart/option/pieChart#tooltip.mark
- VChart github:https://github.com/VisActor/VChart