
如何实现折线图和堆积柱状图的组合?
问题描述
类似这样的组合图
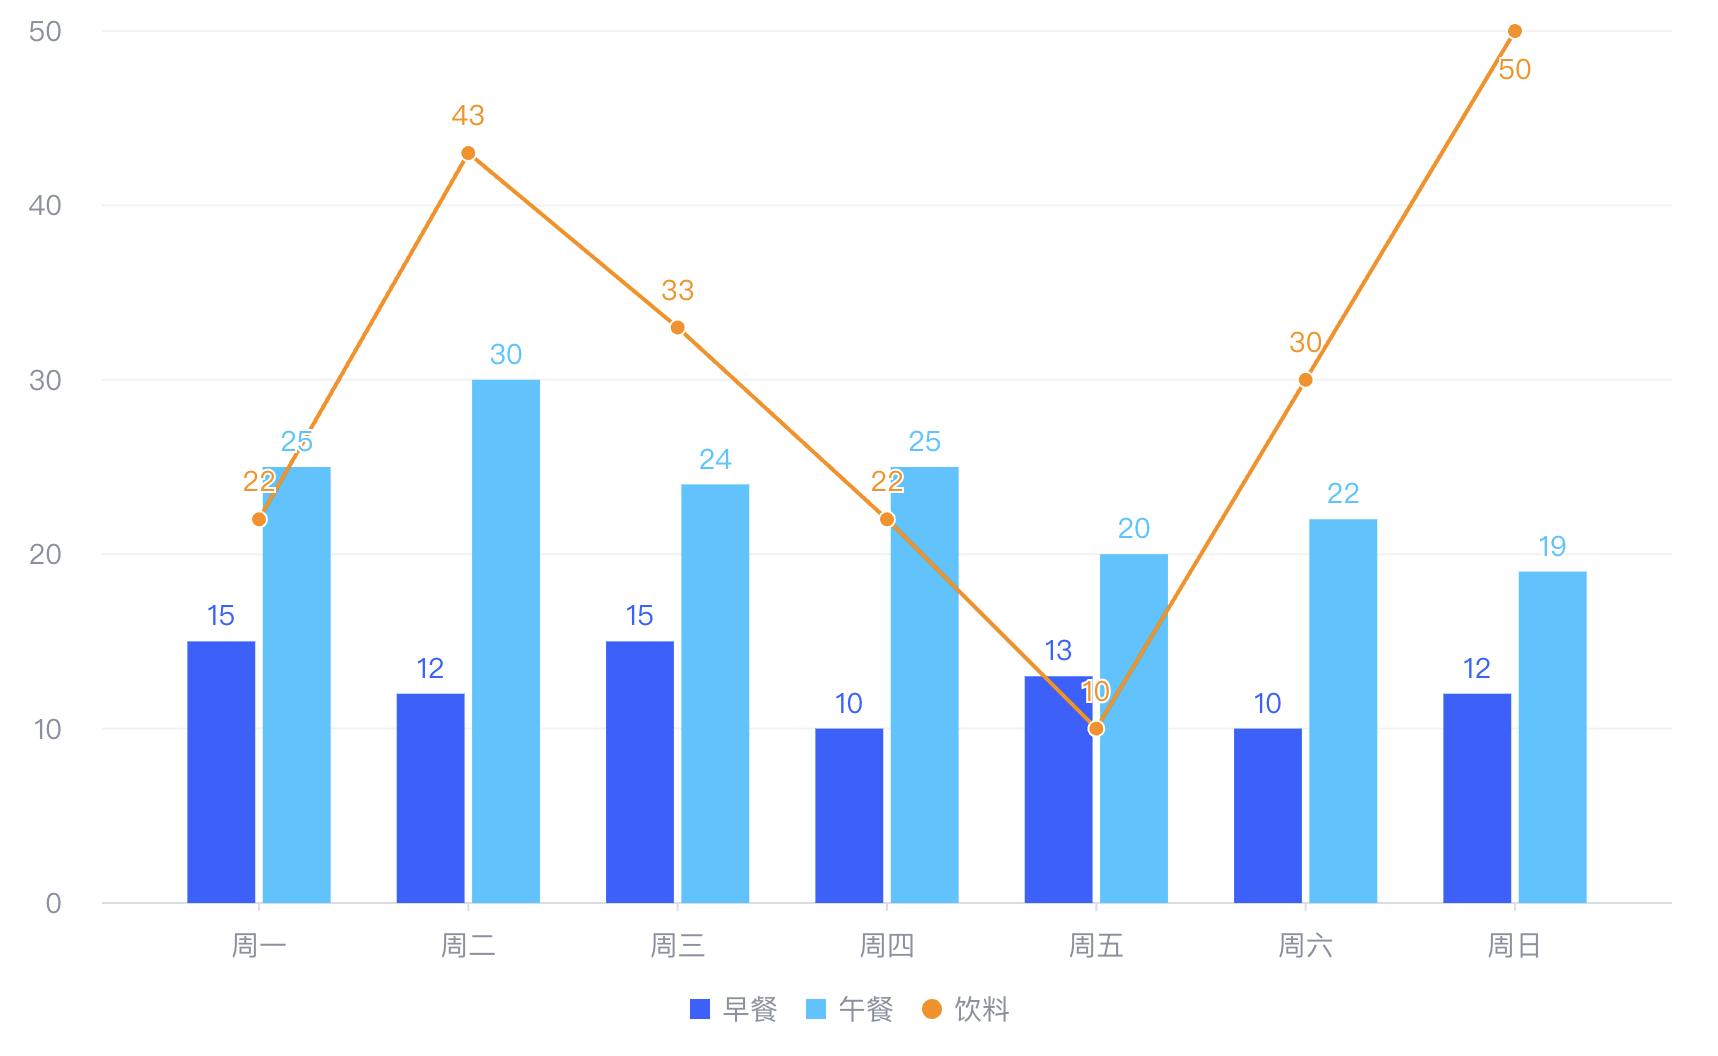
可以实现柱图是堆积的效果吗?
解决方案
不同图表库的解决方案不一样,根据你给的 demo,在 VChart 中对 组合图 中的柱系列,设置 stack: true
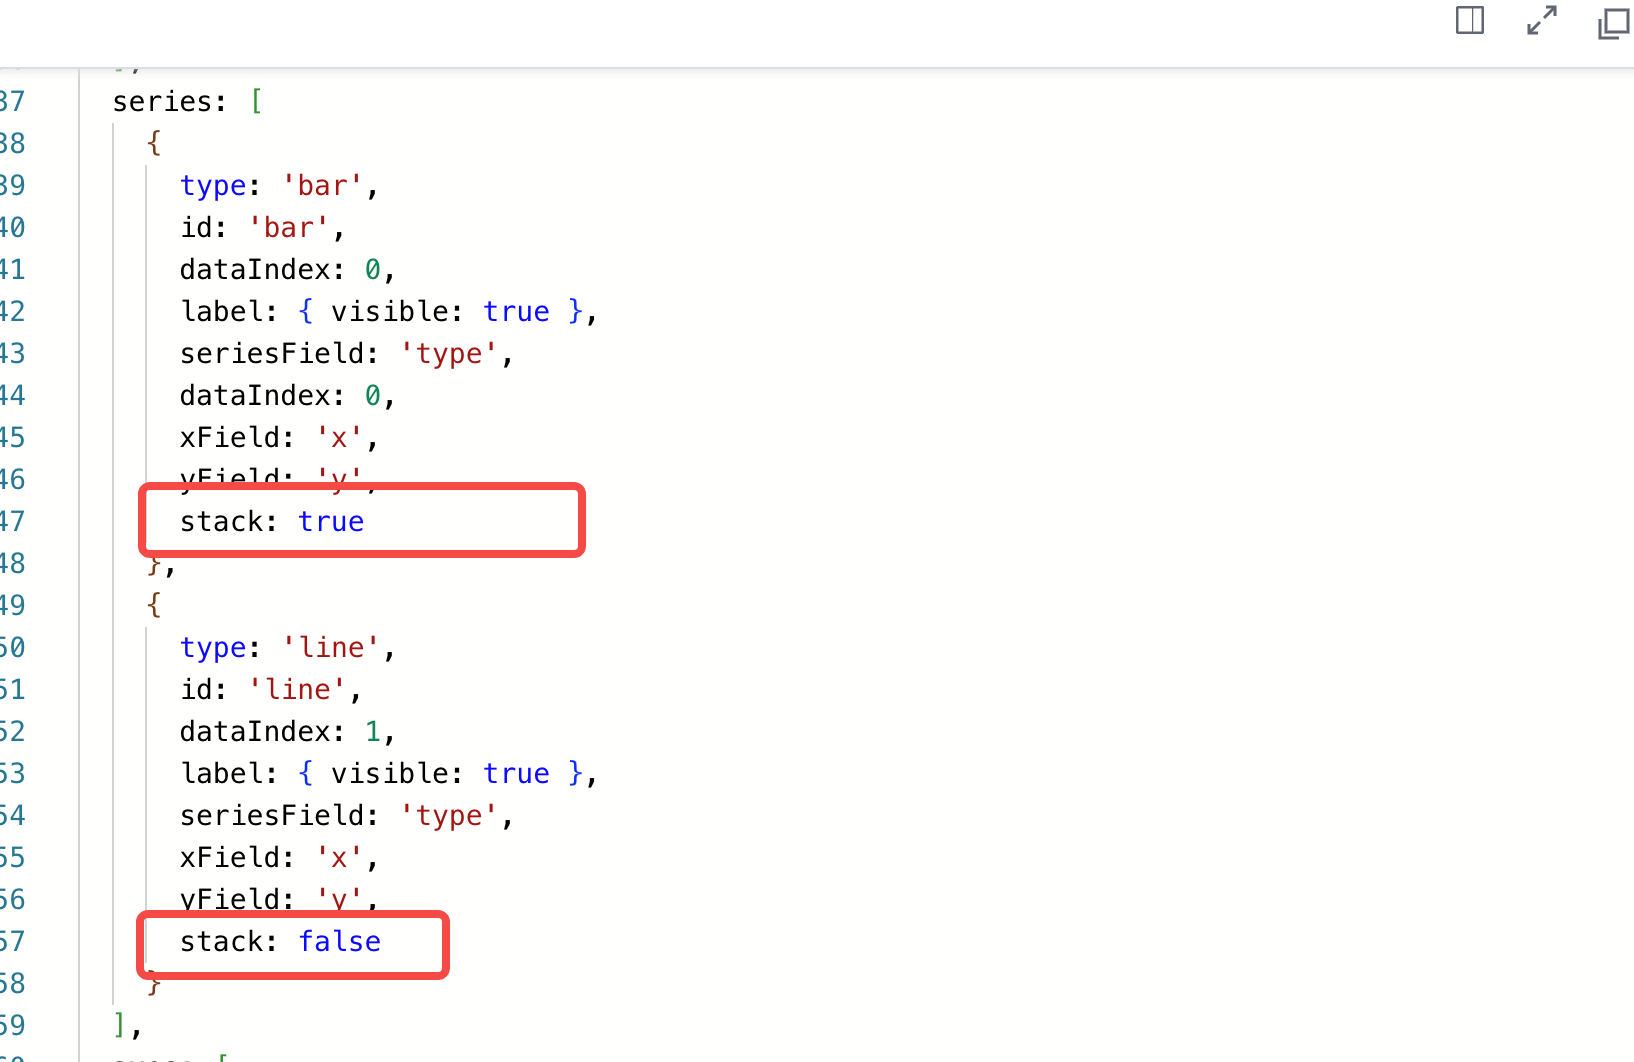
代码示例
const spec = {
  type: 'common',
  seriesField: 'color',
  data: [
    {
      id: 'id0',
      values: [
        { x: '周一', type: '早餐', y: 15 },
        { x: '周一', type: '午餐', y: 25 },
        { x: '周二', type: '早餐', y: 12 },
        { x: '周二', type: '午餐', y: 30 },
        { x: '周三', type: '早餐', y: 15 },
        { x: '周三', type: '午餐', y: 24 },
        { x: '周四', type: '早餐', y: 10 },
        { x: '周四', type: '午餐', y: 25 },
        { x: '周五', type: '早餐', y: 13 },
        { x: '周五', type: '午餐', y: 20 },
        { x: '周六', type: '早餐', y: 10 },
        { x: '周六', type: '午餐', y: 22 },
        { x: '周日', type: '早餐', y: 12 },
        { x: '周日', type: '午餐', y: 19 }
      ]
    },
    {
      id: 'id1',
      values: [
        { x: '周一', type: '饮料', y: 22 },
        { x: '周二', type: '饮料', y: 43 },
        { x: '周三', type: '饮料', y: 33 },
        { x: '周四', type: '饮料', y: 22 },
        { x: '周五', type: '饮料', y: 10 },
        { x: '周六', type: '饮料', y: 30 },
        { x: '周日', type: '饮料', y: 50 }
      ]
    }
  ],
  series: [
    {
      type: 'bar',
      id: 'bar',
      dataIndex: 0,
      label: { visible: true },
      seriesField: 'type',
      dataIndex: 0,
      xField: 'x',
      yField: 'y',
      stack: true
    },
    {
      type: 'line',
      id: 'line',
      dataIndex: 1,
      label: { visible: true },
      seriesField: 'type',
      xField: 'x',
      yField: 'y',
      stack: false
    }
  ],
  axes: [
    { id: 'leftYAxis', orient: 'left', seriesIndex: [0, 1], nice: true },
    { id: 'rightYAxis', orient: 'right', seriesIndex: [0, 1], grid: { visible: false } },
    { orient: 'bottom', label: { visible: true }, type: 'band' }
  ],
  legends: { visible: true, orient: 'bottom' }
};