
如何为图表自定义主题,如在 VChart?
问题描述
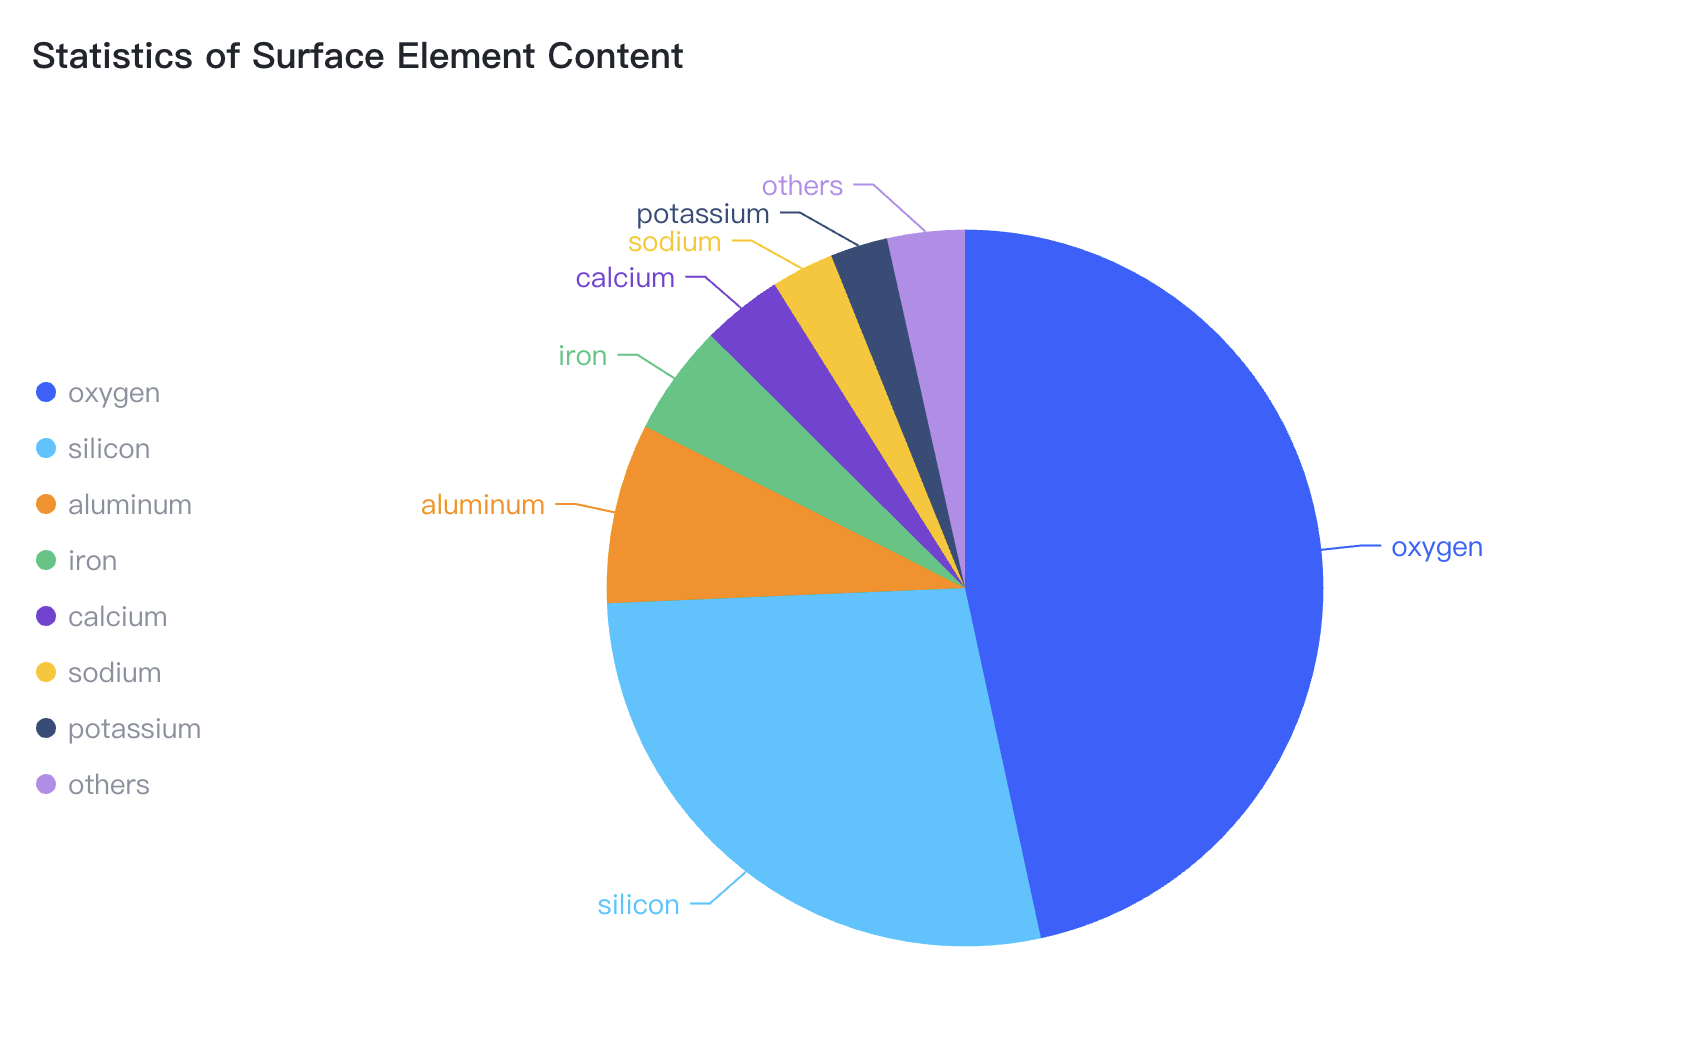
类似 这样的图表,如何一键切换主题?成本如何?
解决方案
不同图表库,切换主题的方案不一样,VChart 是支持主题切换的,详细配置可以参考官网文档:
代码示例
const theme = {
  colorScheme: {
    default: [
      "#fff5f0",
      "#fee0d2",
      "#fcbba1",
      "#fc9272",
      "#fb6a4a",
      "#ef3b2c",
      "#cb181d",
      "#a50f15",
      "#67000d"
    ]
  },
  series: {
    pie: {
      label: {
        position: 'inside'
      }
    }
  },
  component: {
    discreteLegend: {
      visible: true,
      orient: 'top'
    }
  }
};

const spec = {
  type: 'pie',
  theme,
  data: [
    {
      id: 'id0',
      values: [
        { type: 'oxygen', value: '46.60' },
        { type: 'silicon', value: '27.72' },
        { type: 'aluminum', value: '8.13' },
        { type: 'iron', value: '5' },
        { type: 'calcium', value: '3.63' },
        { type: 'sodium', value: '2.83' },
        { type: 'potassium', value: '2.59' },
        { type: 'others', value: '3.5' }
      ]
    }
  ],
  outerRadius: 0.8,
  valueField: 'value',
  categoryField: 'type',
  title: {
    visible: true,
    text: 'Statistics of Surface Element Content'
  },
  label: { visible: true },
  // legends: { visible: true },
  tooltip: {
    mark: {
      content: [
        {
          key: datum => datum['type'],
          value: datum => datum['value'] + '%'
        }
      ]
    }
  }
};