
问题标题
如何配置图元hover状态?
问题描述
如何启用图元的hover高亮效果?
解决方案
以柱状图为例,可以通过bar.state.hover配置hover后的高亮效果。
不同的图表需要配置在不同的图元上,同理,折线图则通过line.state.hover配置。
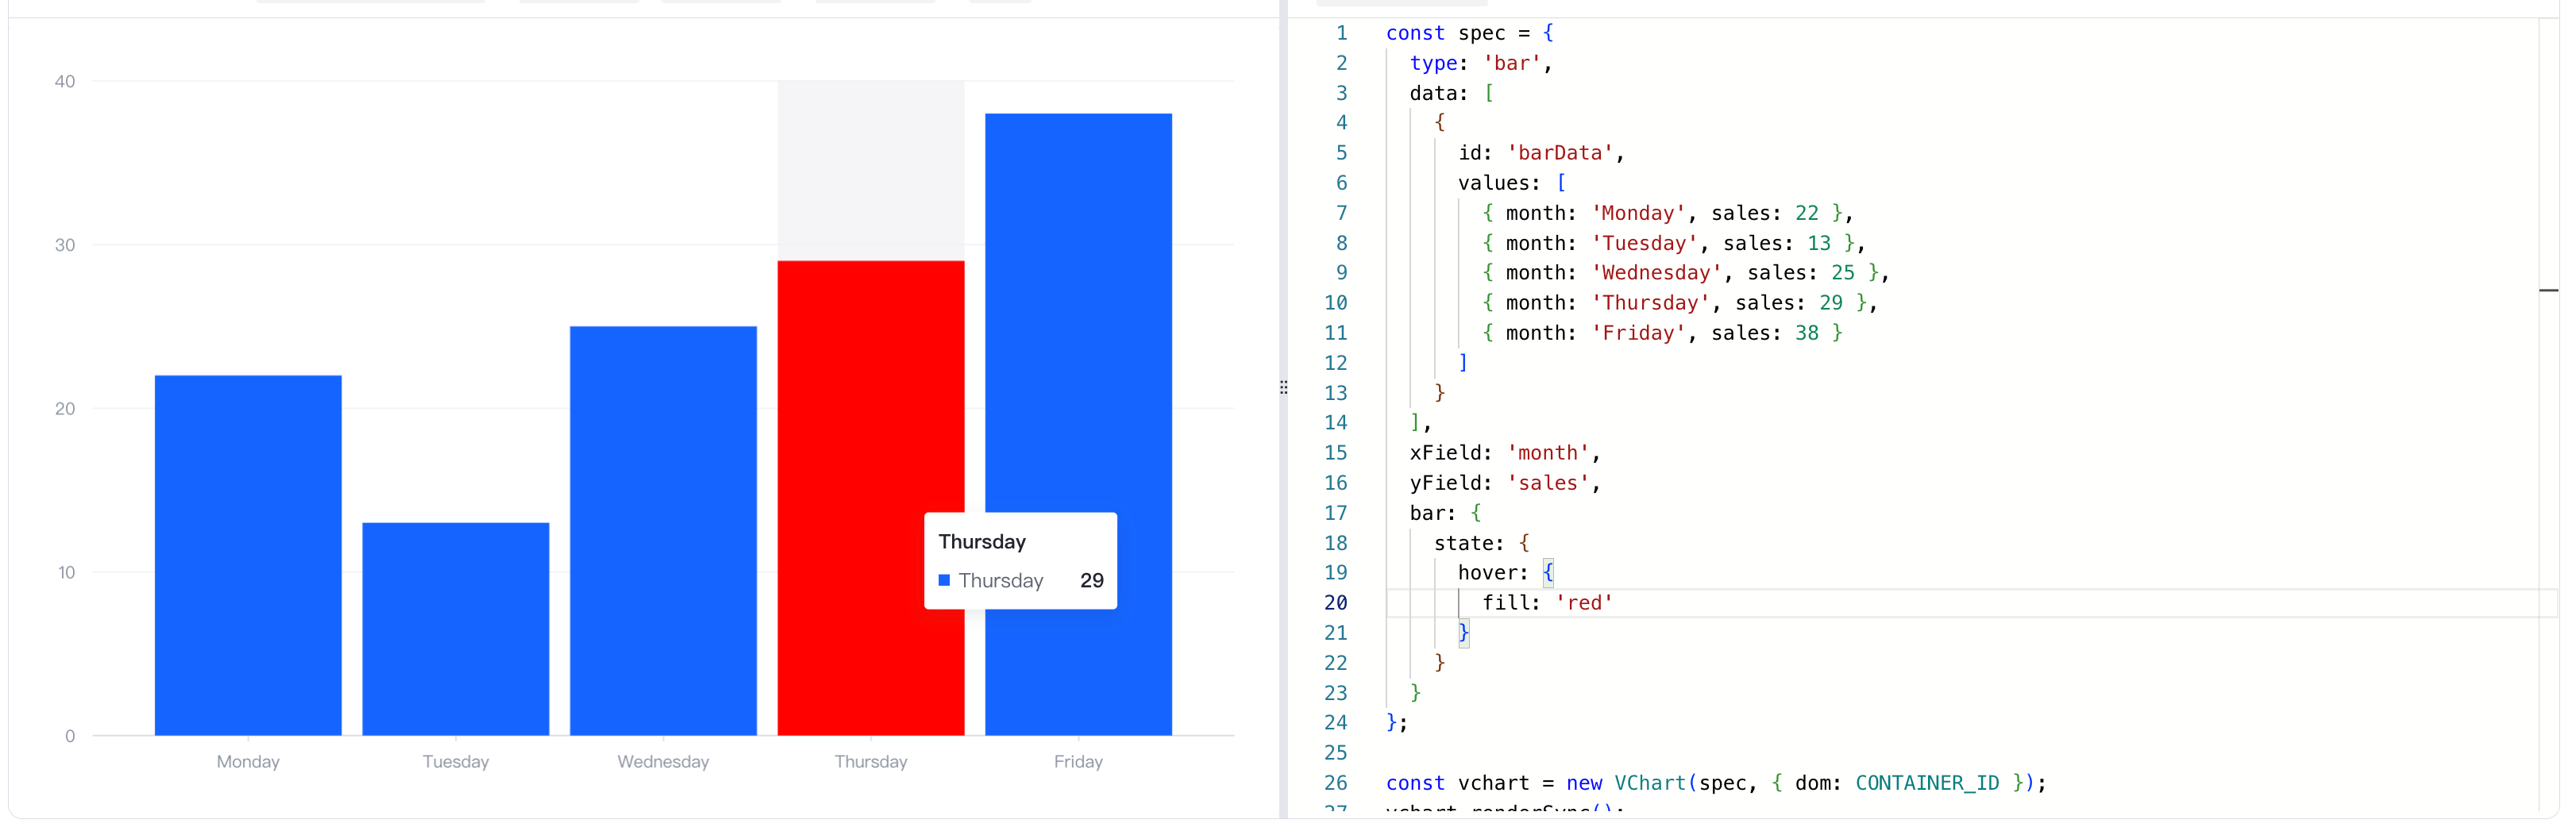
代码示例
const spec = {
  type: 'bar',
  data: [
    {
      id: 'barData',
      values: [
        { month: 'Monday', sales: 22 },
        { month: 'Tuesday', sales: 13 },
        { month: 'Wednesday', sales: 25 },
        { month: 'Thursday', sales: 29 },
        { month: 'Friday', sales: 38 }
      ]
    }
  ],
  xField: 'month',
  yField: 'sales',
  bar: {
    state: {
      hover: {
        fill: 'red'
      }
    }
  }
};

const vchart = new VChart(spec, { dom: CONTAINER_ID });
vchart.renderSync();

// Just for the convenience of console debugging, DO NOT COPY!
window['vchart'] = vchart;</br>
结果展示
在线效果参考:https://codesandbox.io/p/sandbox/hover-state-z5djy8?file=%2Fsrc%2Findex.ts%3A12%2C42

相关文档
相关api:https://www.visactor.io/vchart/option/barChart#bar.state
github:https://github.com/VisActor/VChart