
VChart 中 Tooltip 中怎么能自定义展示数据中的字段?
问题描述
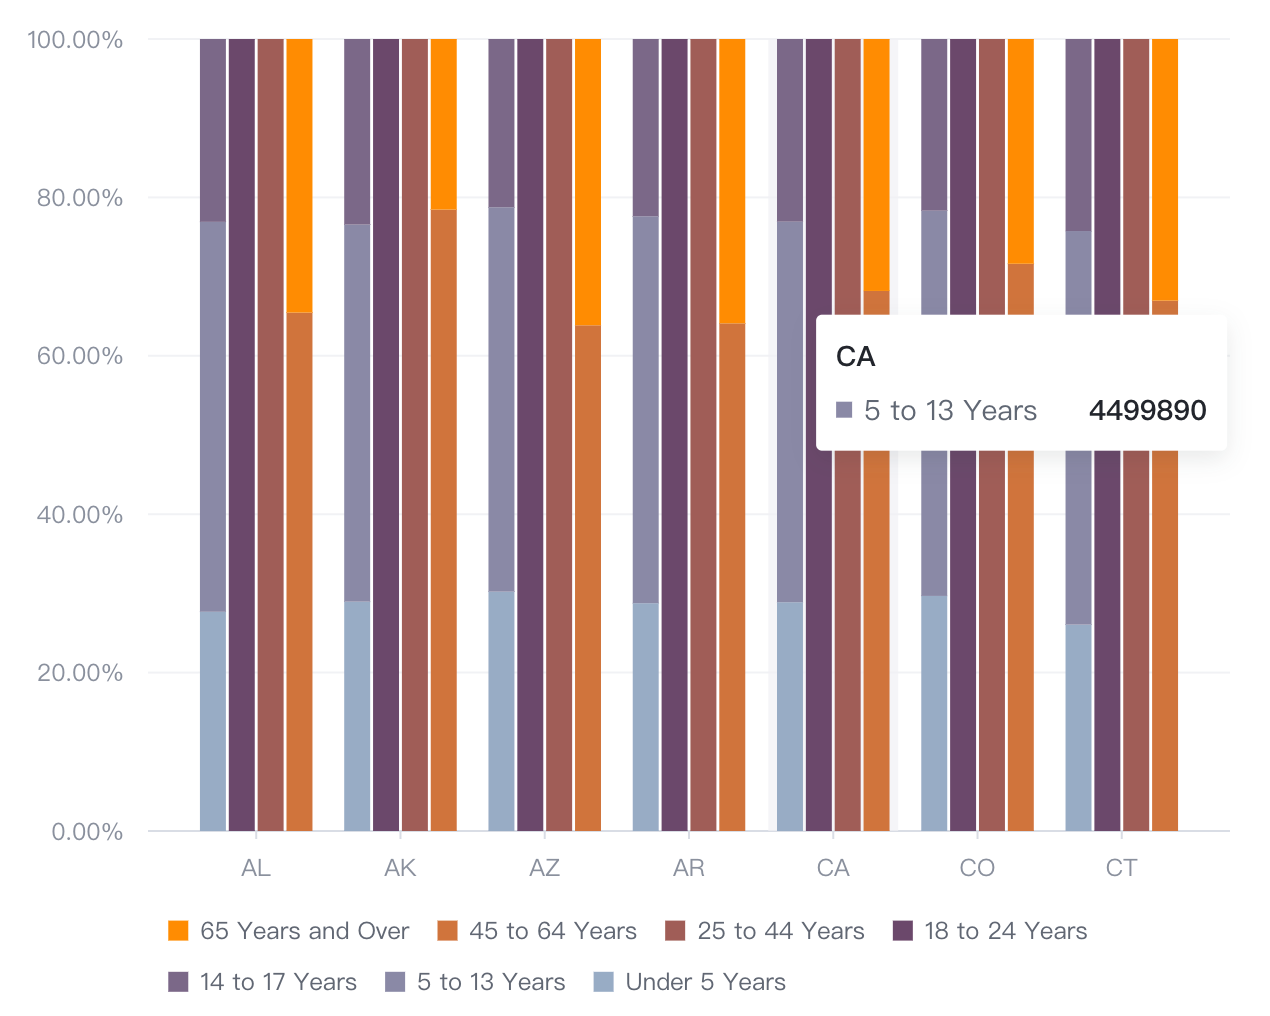
类似 (https://visactor.io/vchart/demo/bar-chart/group-stack-percentage-column)这样的图表,希望tooltip能自定义展示数据中的字段
解决方案
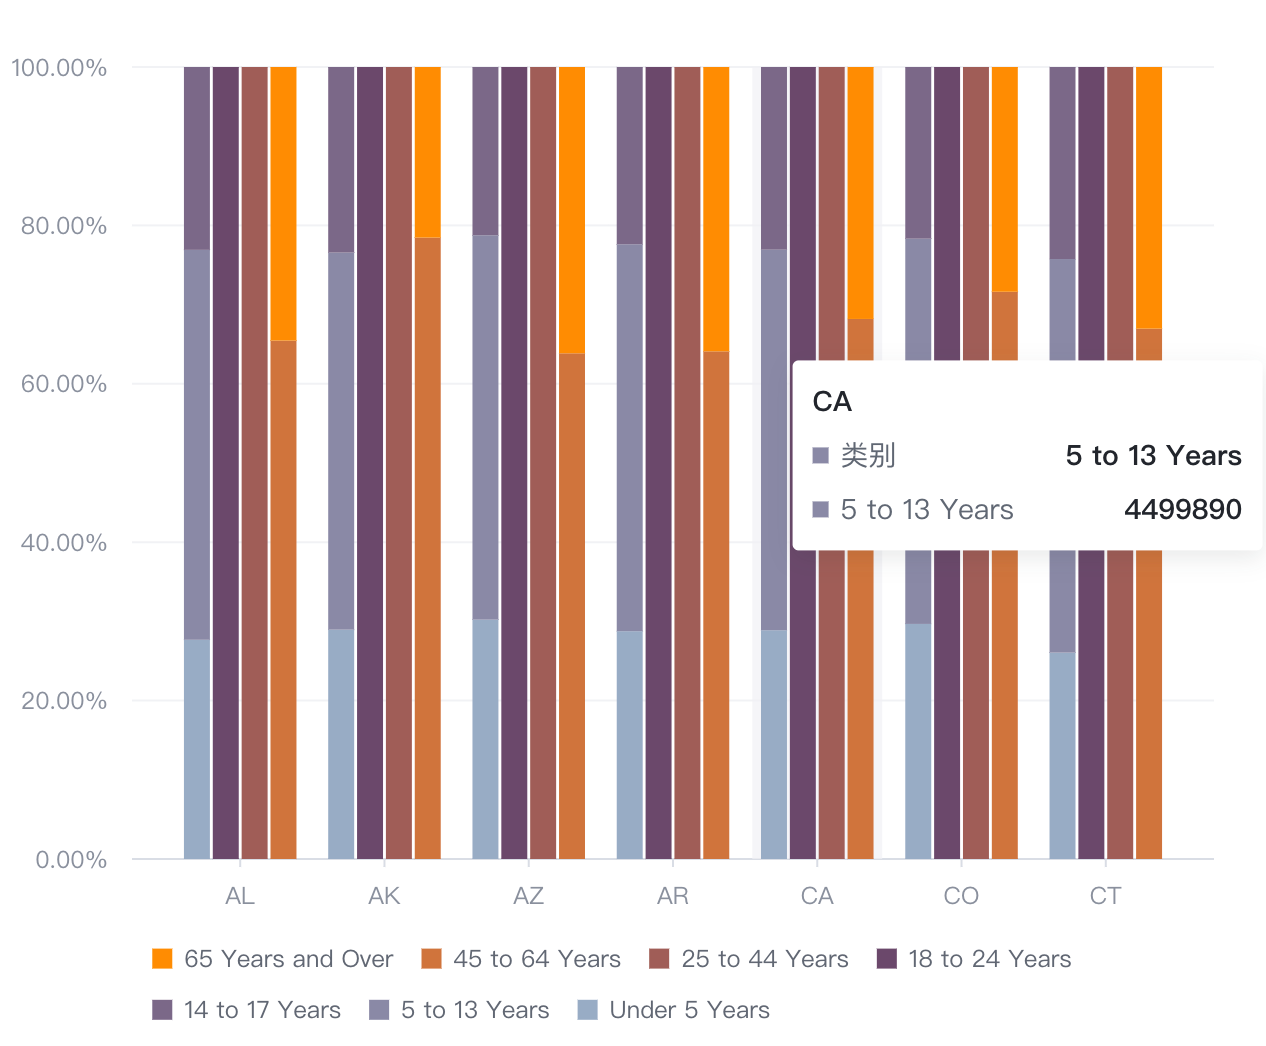
不同图表库的解决方案不一样,根据你给的 demo,在 VChart 中可以直接修改 tooltip 的 content 配置来实现
{
  tooltip: {
    mark: {
      content: [
        { key: '类别', value: datum => datum.age },
        { key: datum => datum.age, value: datum => datum.population }
      ];
    }
  }
}
代码示例
{
  type: 'bar',
  data: [
    {
      id: 'barData',
      values: [
        {
          State: 'AL',
          age: 'Under 5 Years',
          population: 310504,
          type: 'a'
        },
        {
          State: 'AL',
          age: '5 to 13 Years',
          population: 552339,
          type: 'a'
        },
        {
          State: 'AL',
          age: '14 to 17 Years',
          population: 259034,
          type: 'a'
        },
        {
          State: 'AL',
          age: '18 to 24 Years',
          population: 450818,
          type: 'b'
        },
        {
          State: 'AL',
          age: '25 to 44 Years',
          population: 1231572,
          type: 'c'
        },
        {
          State: 'AL',
          age: '45 to 64 Years',
          population: 1215966,
          type: 'd'
        },
        {
          State: 'AL',
          age: '65 Years and Over',
          population: 641667,
          type: 'd'
        },
        {
          State: 'AK',
          age: 'Under 5 Years',
          population: 52083,
          type: 'a'
        },
        {
          State: 'AK',
          age: '5 to 13 Years',
          population: 85640,
          type: 'a'
        },
        {
          State: 'AK',
          age: '14 to 17 Years',
          population: 42153,
          type: 'a'
        },
        {
          State: 'AK',
          age: '18 to 24 Years',
          population: 74257,
          type: 'b'
        },
        {
          State: 'AK',
          age: '25 to 44 Years',
          population: 198724,
          type: 'c'
        },
        {
          State: 'AK',
          age: '45 to 64 Years',
          population: 183159,
          type: 'd'
        },
        {
          State: 'AK',
          age: '65 Years and Over',
          population: 50277,
          type: 'd'
        },
        {
          State: 'AZ',
          age: 'Under 5 Years',
          population: 515910,
          type: 'a'
        },
        {
          State: 'AZ',
          age: '5 to 13 Years',
          population: 828669,
          type: 'a'
        },
        {
          State: 'AZ',
          age: '14 to 17 Years',
          population: 362642,
          type: 'a'
        },
        {
          State: 'AZ',
          age: '18 to 24 Years',
          population: 601943,
          type: 'b'
        },
        {
          State: 'AZ',
          age: '25 to 44 Years',
          population: 1804762,
          type: 'c'
        },
        {
          State: 'AZ',
          age: '45 to 64 Years',
          population: 1523681,
          type: 'd'
        },
        {
          State: 'AZ',
          age: '65 Years and Over',
          population: 862573,
          type: 'd'
        },
        {
          State: 'AR',
          age: 'Under 5 Years',
          population: 202070,
          type: 'a'
        },
        {
          State: 'AR',
          age: '5 to 13 Years',
          population: 343207,
          type: 'a'
        },
        {
          State: 'AR',
          age: '14 to 17 Years',
          population: 157204,
          type: 'a'
        },
        {
          State: 'AR',
          age: '18 to 24 Years',
          population: 264160,
          type: 'b'
        },
        {
          State: 'AR',
          age: '25 to 44 Years',
          population: 754420,
          type: 'c'
        },
        {
          State: 'AR',
          age: '45 to 64 Years',
          population: 727124,
          type: 'd'
        },
        {
          State: 'AR',
          age: '65 Years and Over',
          population: 407205,
          type: 'd'
        },
        {
          State: 'CA',
          age: 'Under 5 Years',
          population: 2704659,
          type: 'a'
        },
        {
          State: 'CA',
          age: '5 to 13 Years',
          population: 4499890,
          type: 'a'
        },
        {
          State: 'CA',
          age: '14 to 17 Years',
          population: 2159981,
          type: 'a'
        },
        {
          State: 'CA',
          age: '18 to 24 Years',
          population: 3853788,
          type: 'b'
        },
        {
          State: 'CA',
          age: '25 to 44 Years',
          population: 10604510,
          type: 'c'
        },
        {
          State: 'CA',
          age: '45 to 64 Years',
          population: 8819342,
          type: 'd'
        },
        {
          State: 'CA',
          age: '65 Years and Over',
          population: 4114496,
          type: 'd'
        },
        {
          State: 'CO',
          age: 'Under 5 Years',
          population: 358280,
          type: 'a'
        },
        {
          State: 'CO',
          age: '5 to 13 Years',
          population: 587154,
          type: 'a'
        },
        {
          State: 'CO',
          age: '14 to 17 Years',
          population: 261701,
          type: 'a'
        },
        {
          State: 'CO',
          age: '18 to 24 Years',
          population: 466194,
          type: 'b'
        },
        {
          State: 'CO',
          age: '25 to 44 Years',
          population: 1464939,
          type: 'c'
        },
        {
          State: 'CO',
          age: '45 to 64 Years',
          population: 1290094,
          type: 'd'
        },
        {
          State: 'CO',
          age: '65 Years and Over',
          population: 511094,
          type: 'd'
        },
        {
          State: 'CT',
          age: 'Under 5 Years',
          population: 211637,
          type: 'a'
        },
        {
          State: 'CT',
          age: '5 to 13 Years',
          population: 403658,
          type: 'a'
        },
        {
          State: 'CT',
          age: '14 to 17 Years',
          population: 196918,
          type: 'a'
        },
        {
          State: 'CT',
          age: '18 to 24 Years',
          population: 325110,
          type: 'b'
        },
        {
          State: 'CT',
          age: '25 to 44 Years',
          population: 916955,
          type: 'c'
        },
        {
          State: 'CT',
          age: '45 to 64 Years',
          population: 968967,
          type: 'd'
        },
        {
          State: 'CT',
          age: '65 Years and Over',
          population: 478007,
          type: 'd'
        }
      ]
    }
  ],
  xField: ['State', 'type'],
  yField: 'population',
  seriesField: 'age',
  stack: true,
  percent: true,
  legends: {
    visible: true,
    reversed: true
  },
  tooltip: {
    mark: {
      content: [
        {key: '类别', value: (datum) => datum.age},
        {key: (datum) => datum.age, value: (datum) => datum.population}
      ]
    }
  },
  color: ['#98abc5', '#8a89a6', '#7b6888', '#6b486b', '#a05d56', '#d0743c', '#ff8c00'],
  axes: [
    {
      orient: 'left',
      label: {
        formatMethod: val => {
          return `${(val * 100).toFixed(2)}%`;
        }
      }
    }
  ]
}
结果展示
在线效果参考:https://codesandbox.io/s/tooltip-custom-6czn8z
相关文档
Tooltip 教程:https://visactor.io/vchart/guide/tutorial_docs/Chart_Concepts/Tooltip 相关 api:https://visactor.io/vchart/option/barChart#tooltip.mark.content(Object%7CObject%5B%5D).key github:https://github.com/VisActor/VChart