
如何控制堆叠以及图例的显示顺序,同时在 tooltip 上添加总计信息的展示?
问题描述
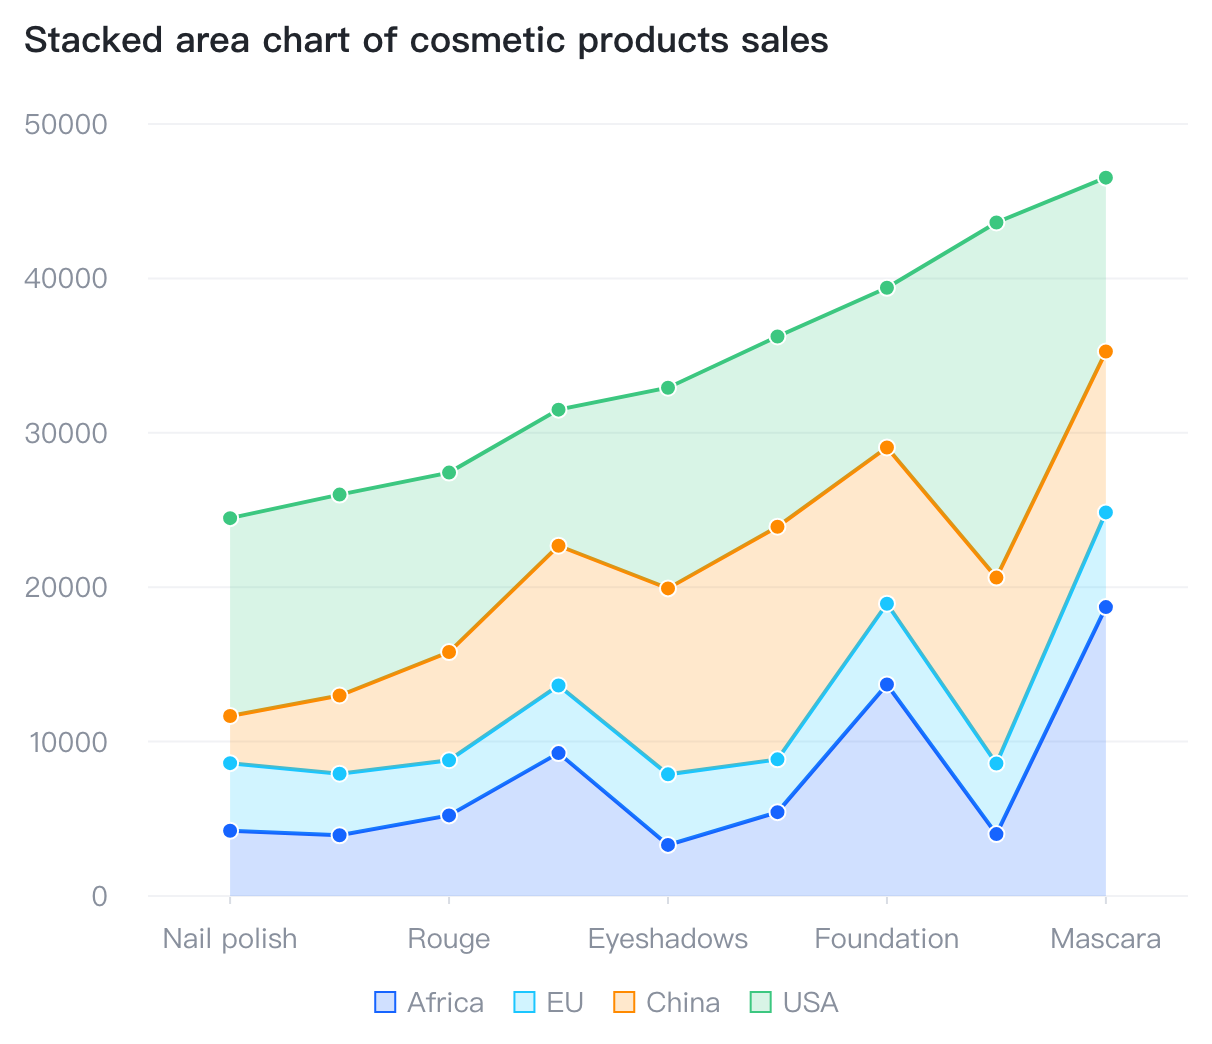
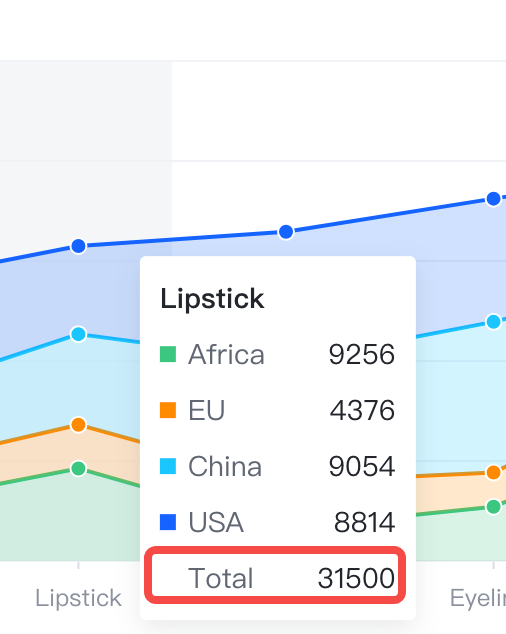
对于堆叠面积图,我想要控制堆叠的顺序,比如期望面积图从下到上,按照 "China", "USA", "EU", "Africa" 的顺序堆叠,然后图例的显示顺序也按照 "China", "USA", "EU", "Africa" 的顺序从左到右显示,同时 hover 上去的时候,tooltip 能够展示总计的信息,如下图所示:
解决方案
这个在 VChart 上可以非常简单得配置出来,只需要两步:
- 通过在
data.fields属性上为分组字段配置domain和sortIndex来控制堆叠的顺序domain来声明顺序sortIndex声明为 0 表示按照domain顺序进行排序
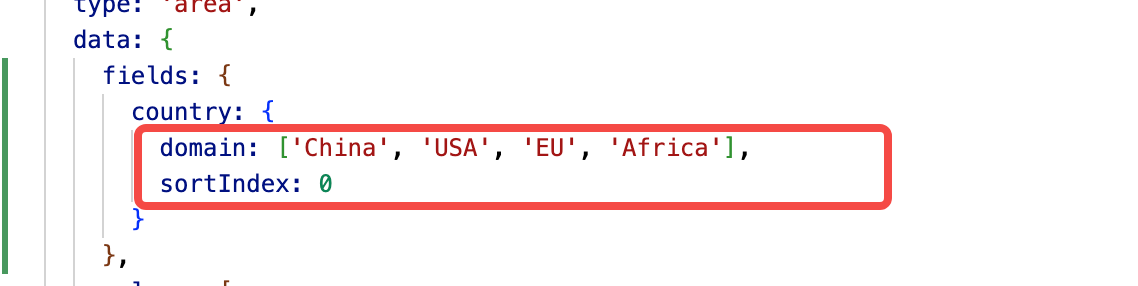
因为图例的顺序默认是按照字段 domain 声明的顺序展示的,所以图例这里不需要进行配置。
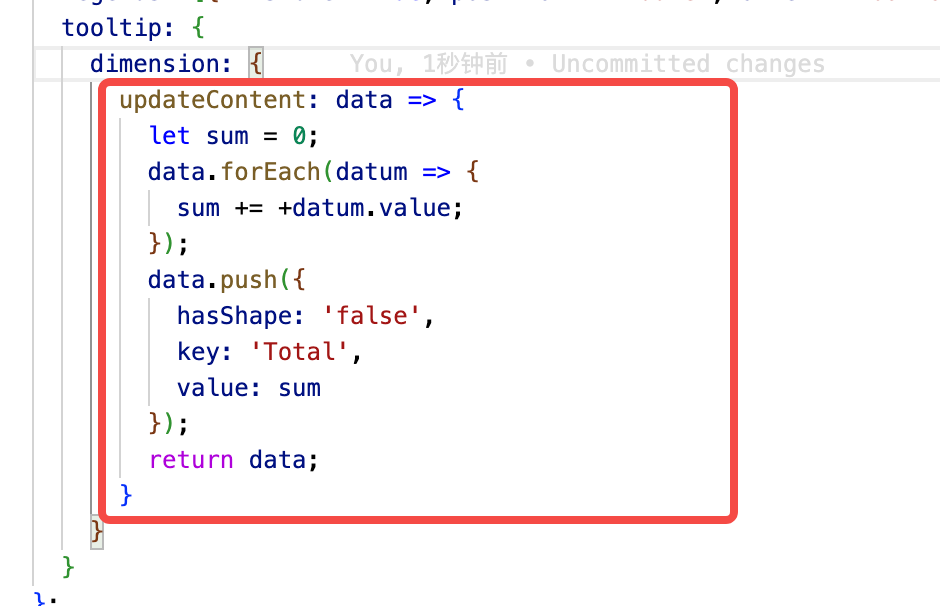
- 通过为
tooltip.dimension配置updateContent可以动态得为 tooltip 的内容添加需要的信息,而且也可以拿到当前 tooltip 展示的所有信息
代码示例
结果展示
在线效果参考:https://codepen.io/Sima/pen/WNLxdyg
相关文档
堆积面积图 demo:https://www.visactor.io/vchart/demo/area-chart/stacked-area
面积图教程: https://www.visactor.io/vchart/guide/tutorial_docs/Chart_Types/Area
数据配置教程:https://www.visactor.io/vchart/guide/tutorial_docs/Chart_Concepts/Data/Data_Types_and_Interface
Tooltip 配置教程:https://www.visactor.io/vchart/guide/tutorial_docs/Chart_Concepts/Tooltip
数据字段配置:https://www.visactor.io/vchart/option/areaChart#data(IDataType%7CIDataType%5B%5D).IDataValues.fields
Tooltip 配置项:https://www.visactor.io/vchart/option/areaChart#tooltip.visible