问题标题
如何在折线图的axes上配置轴单位的展示?
问题描述
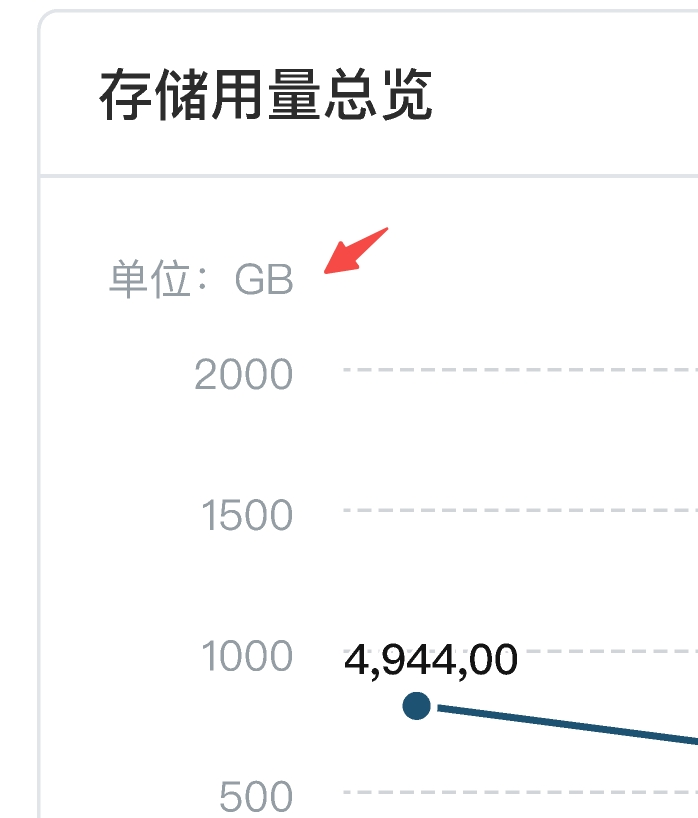
想配置 Y轴上面这种单位展示,需要用哪个参数配置?
解决方案
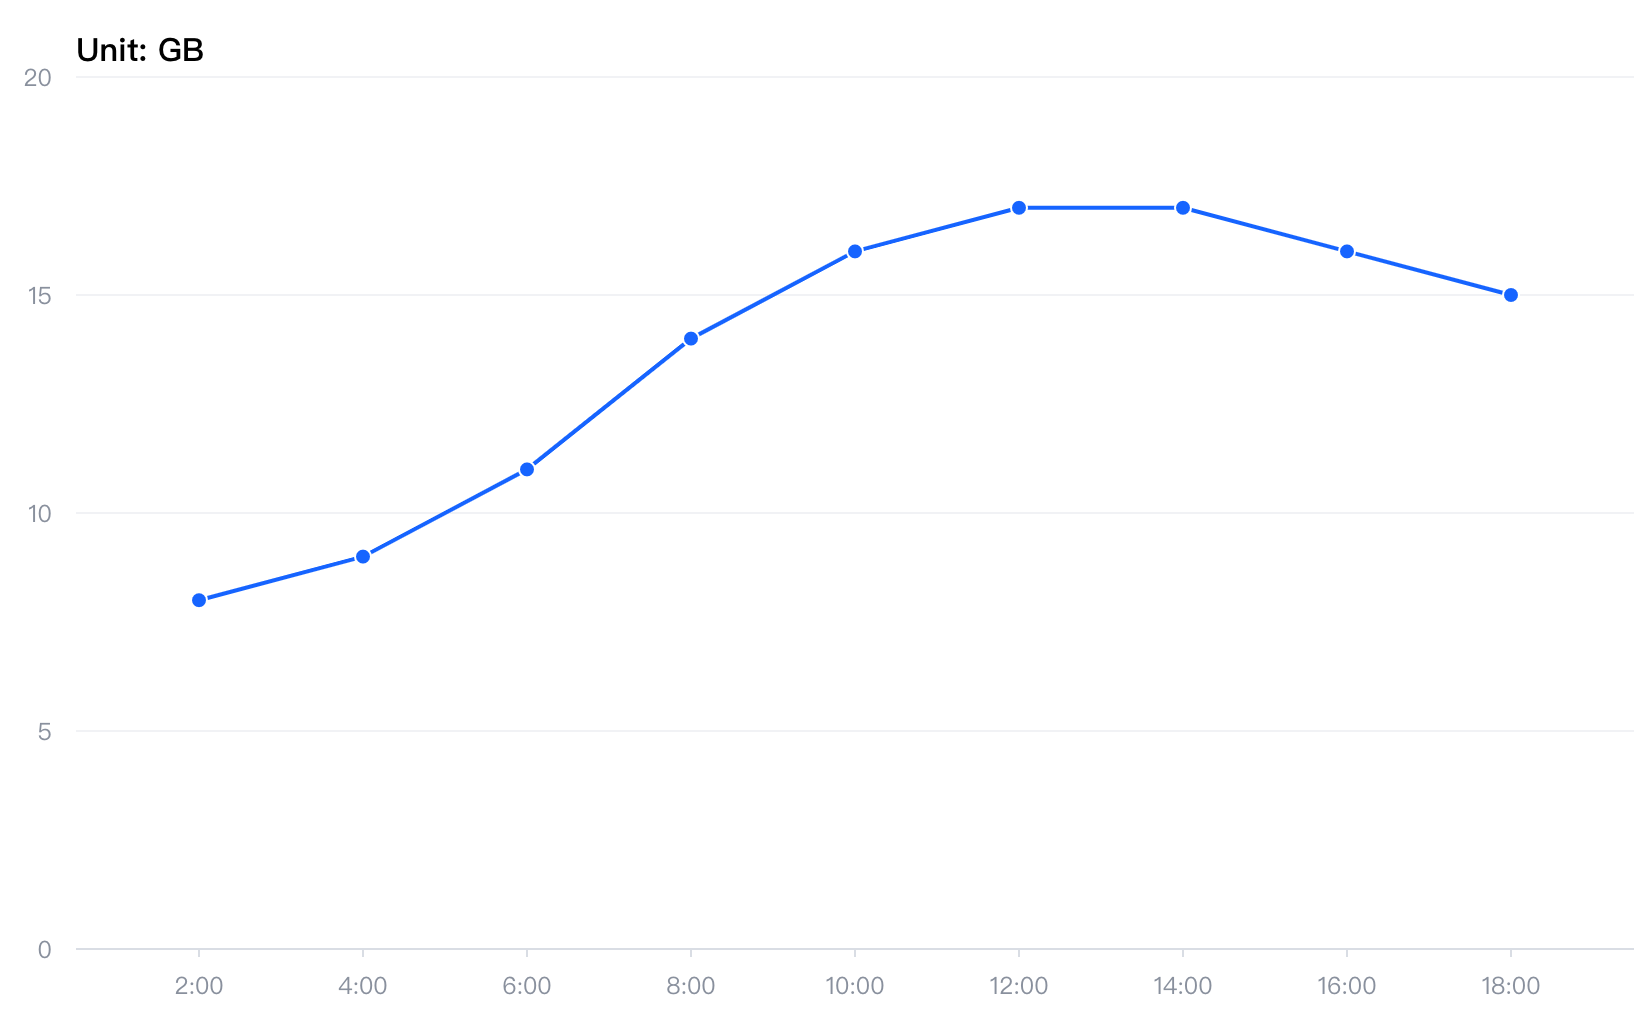
可以在轴的配置项中设置 unit 配置来开启轴单位的显示。轴单位显示的文本内容以及轴单位样式均可以通过 unit 配置项进行调整。
    {
      orient: 'left',
      unit: {
        visible: true,
        text: 'Unit: GB',
        style: { fontSize: 16, fontWeight: 'bold', fill: '#000' }
      }
    }</br>
代码示例
const spec = {
  type: 'line',
  data: {
    values: [
      {
        time: '2:00',
        value: 8
      },
      {
        time: '4:00',
        value: 9
      },
      {
        time: '6:00',
        value: 11
      },
      {
        time: '8:00',
        value: 14
      },
      {
        time: '10:00',
        value: 16
      },
      {
        time: '12:00',
        value: 17
      },
      {
        time: '14:00',
        value: 17
      },
      {
        time: '16:00',
        value: 16
      },
      {
        time: '18:00',
        value: 15
      }
    ]
  },
  xField: 'time',
  yField: 'value',
  axes: [
    { orient: 'bottom' },
    {
      orient: 'left',
      unit: {
        visible: true,
        text: 'Unit: GB',
        style: { fontSize: 16, fontWeight: 'bold', fill: '#000' }
      }
    }
  ]
};

const vchart = new VChart(spec, { dom: CONTAINER_ID });
vchart.renderSync();

// Just for the convenience of console debugging, DO NOT COPY!
window['vchart'] = vchart;</br>
结果展示