问题标题
如何在line chart的tooltip中显示“加和”?
问题描述
我在使用line chart时,想要在tooltip中显示“加和”这个项,但是不知道该如何实现。请问该怎么做?
解决方案
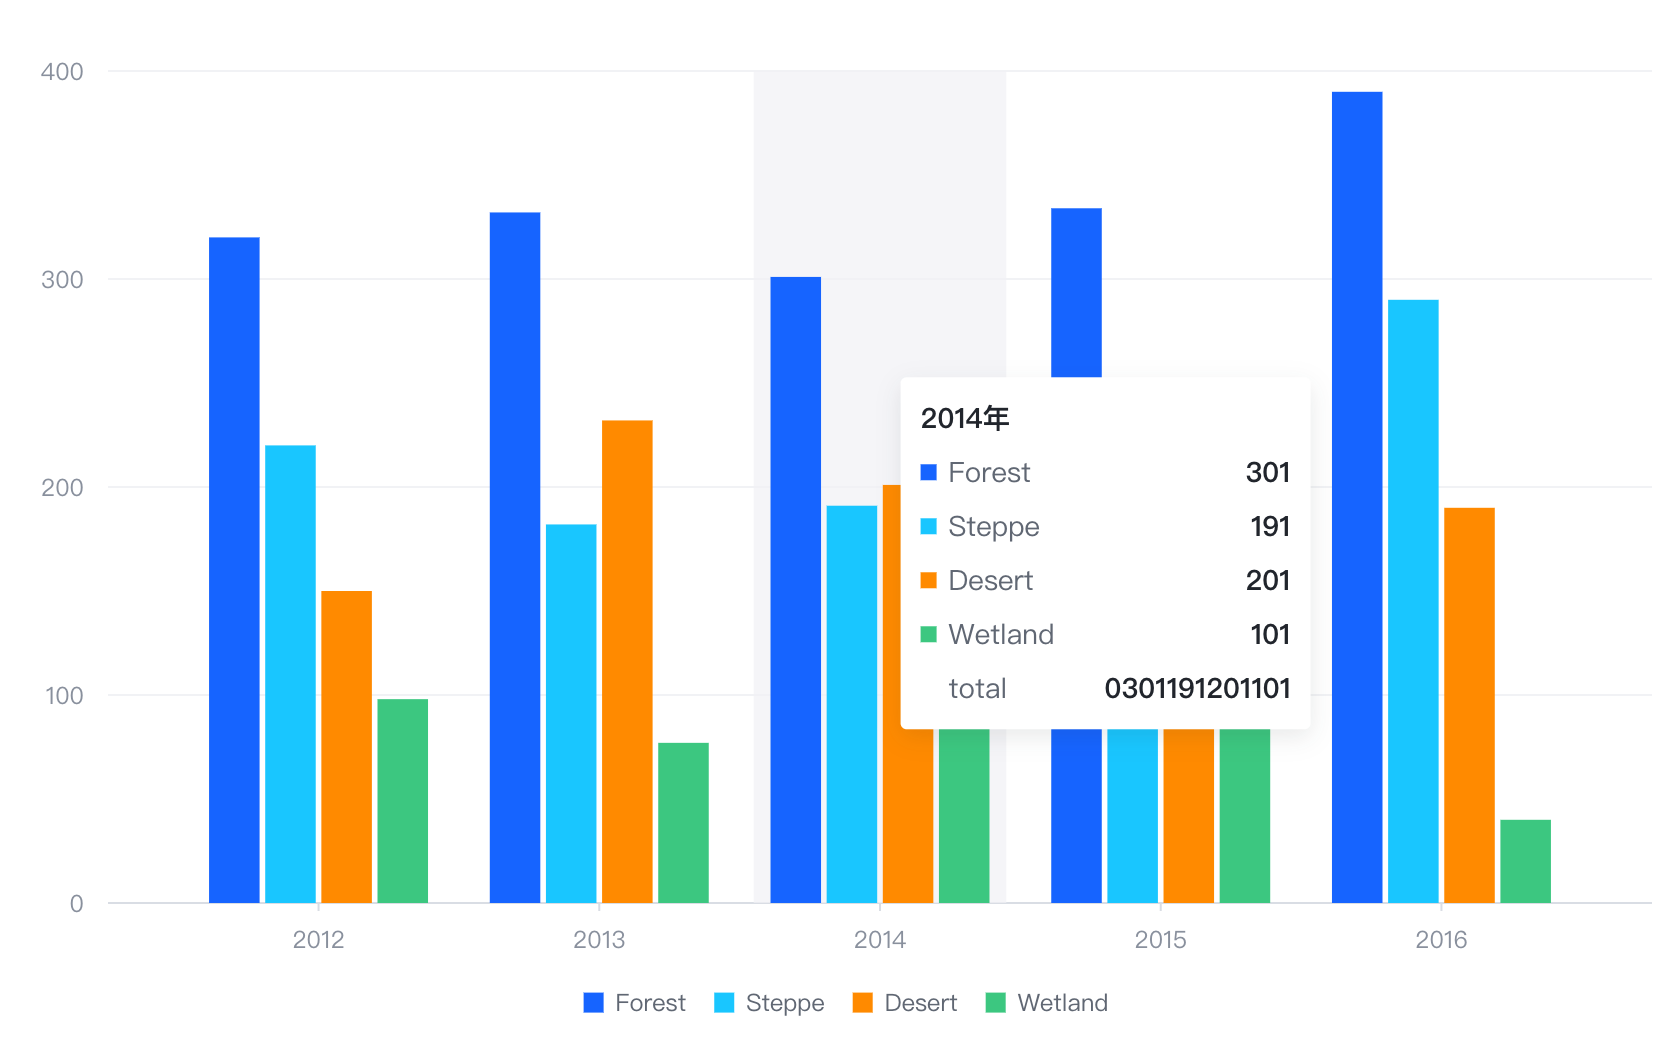
可以使用updateContent来做一个tooltip内容的后处理。
在dimension的content中,可以添加一个key为“加和”的项,value为一个函数,该函数接收一个datumList参数,表示当前tooltip中所有数据的列表,然后计算出所有数据的value的和,返回即可。
在updateContent中,也可以添加一个key为“加和”的项,value为同样的函数,这样就可以在tooltip中显示“加和”这�个项了。
代码示例
const data = [
  { year: '2012', type: 'Forest', value: 320 },
  { year: '2012', type: 'Steppe', value: 220 },
  { year: '2012', type: 'Desert', value: 150 },
  { year: '2012', type: 'Wetland', value: 98 },
  { year: '2013', type: 'Forest', value: 332 },
  { year: '2013', type: 'Steppe', value: 182 },
  { year: '2013', type: 'Desert', value: 232 },
  { year: '2013', type: 'Wetland', value: 77 },
  { year: '2014', type: 'Forest', value: 301 },
  { year: '2014', type: 'Steppe', value: 191 },
  { year: '2014', type: 'Desert', value: 201 },
  { year: '2014', type: 'Wetland', value: 101 },
  { year: '2015', type: 'Forest', value: 334 },
  { year: '2015', type: 'Steppe', value: 234 },
  { year: '2015', type: 'Desert', value: 154 },
  { year: '2015', type: 'Wetland', value: 99 },
  { year: '2016', type: 'Forest', value: 390 },
  { year: '2016', type: 'Steppe', value: 290 },
  { year: '2016', type: 'Desert', value: 190 },
  { year: '2016', type: 'Wetland', value: 40 }
];
const aggregation = {};
data.forEach(({ year, value }) => {
  if (!aggregation[year]) {
    aggregation[year] = 0;
  }
  aggregation[year] += value;
});
const spec = {
  type: 'bar',
  data: [{ id: 'bar', values: data }],
  xField: ['year', 'type'],
  yField: 'value',
  seriesField: 'type',
  bar: { state: { legend_hover_reverse: { fill: '#ccc' } } },
  legends: { visible: true },
  tooltip: {
    mark: {
      title: { value: (datum) => datum['year'] + '年' },
      content: [
        { key: (datum) => datum['type'], value: (datum) => datum['value'] },
        {
          hasShape: false,
          key: 'Proportion',
          value: (datum) => Math.round((datum['value'] / aggregation[datum['year']]) * 10000) / 100 + '%'
        }
      ]
    },
    dimension: {
      title: { value: (datum) => datum['year'] + '年' },
      content: [{ key: (datum) => datum['type'], value: (datum) => datum['value'] }],
      updateContent: (prev) => {
        console.log(prev);
        const total = prev.reduce((acc, cur) => {
          return acc + cur.value;
        }, 0);
        return (prev ?? []).concat({ key: 'total', value: total });
      }
    }
  }
};
const vchart = new VChart(spec, { dom: CONTAINER_ID });
vchart.renderAsync(); // Just for the convenience of console debugging, DO NOT COPY! window['vchart'] = vchart;
</br>
结果展示