
问题标题
VTable表格组件如何让相邻迷你折线图的直接的间隔变大?
问题描述
产品中使用到了VTable的迷你图,但是数据生成迷你图的效果用户觉得相邻折线间的距离太近了,请问怎么调整这个间距?
解决方案
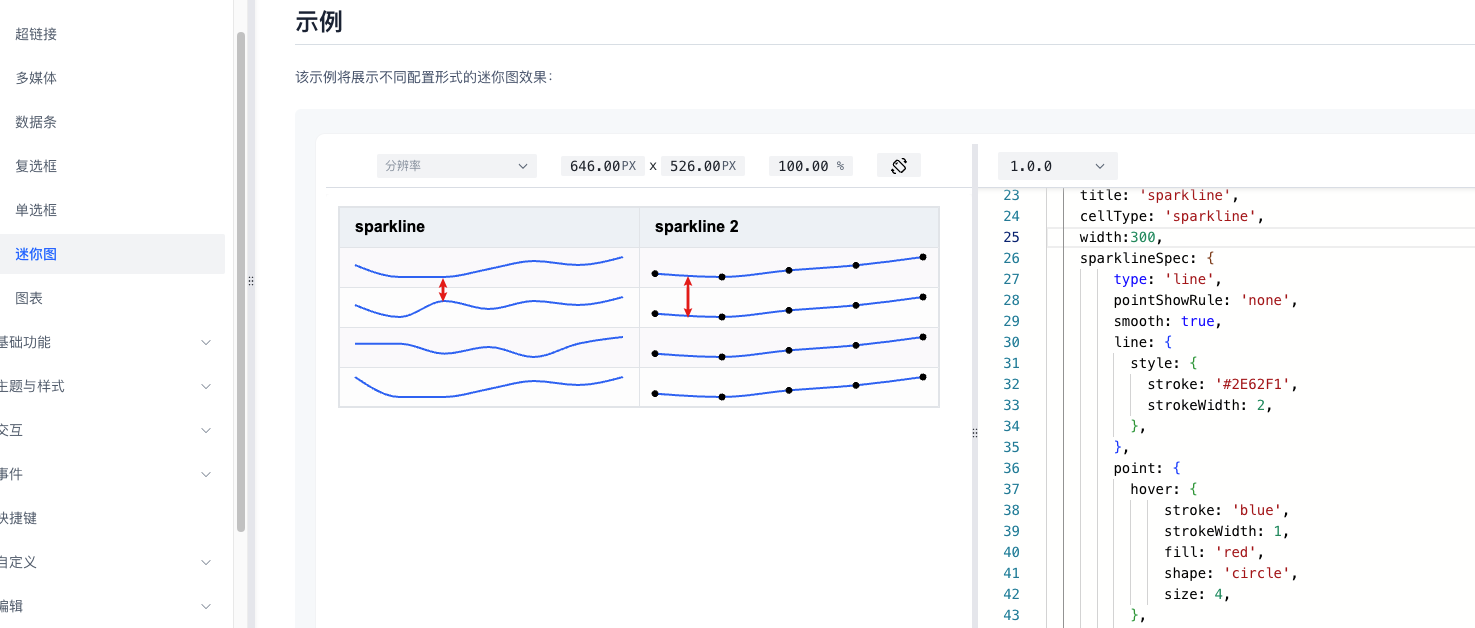
首先需要明确一个单元格的宽高是包括了两部分,padding内边距和内容。其中padding在VTable中默认是[10, 16, 10, 16],VTable的行高默认是40px,上下内边距占了20px,内容高度剩20px。
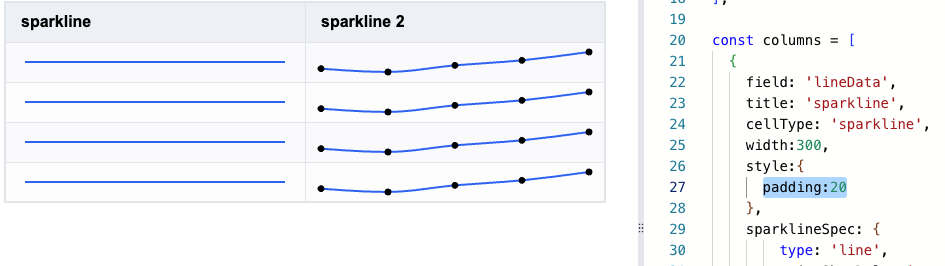
上下内边距占了20px,相邻两个迷你折线图的最短间距也就是20px。也就是说相邻两个迷你折线图的最短间距是由padding决定的。那在官网示例中将padding调整为20,调整后发现线条曲线成直线了,这是因为40的行高都被边距占掉了,折线图没有了伸展空间。
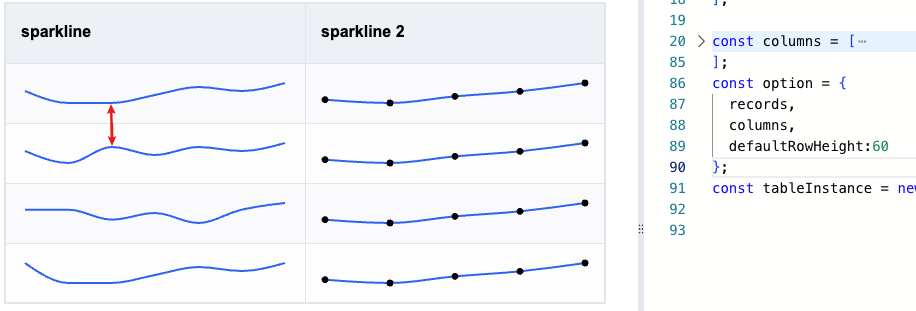
那么此时需要相应的加大行高才行,设置defaultRowHeight为60的效果如下:

代码示例
const records = [
  {
   'lineData':[50,20,20,40,60,50,70],
   'lineData2':[{x:1,y:1500},{x:2,y:1480},{x:3,y:1520},{x:4,y:1550},{x:5,y:1600}],
  },
  {
   'lineData':[50,20,60,40,60,50,70],
   'lineData2':[{x:1,y:1500},{x:2,y:1480},{x:3,y:1520},{x:4,y:1550},{x:5,y:1600}],
  },
  {
   'lineData':[50,50,20,40,10,50,70],
   'lineData2':[{x:1,y:1500},{x:2,y:1480},{x:3,y:1520},{x:4,y:1550},{x:5,y:1600}],
  },
  {
   'lineData':[70,20,20,40,60,50,70],
   'lineData2':[{x:1,y:1500},{x:2,y:1480},{x:3,y:1520},{x:4,y:1550},{x:5,y:1600}],
  }
];

const columns = [
  {
    field: 'lineData',
    title: 'sparkline',
    cellType: 'sparkline',
    width:300,
    style:{
      padding:20
    },
    sparklineSpec: {
        type: 'line',
        pointShowRule: 'none',
        smooth: true,
        line: {
          style: {
            stroke: '#2E62F1',
            strokeWidth: 2,
          },
        },
        point: {
          hover: {
              stroke: 'blue',
              strokeWidth: 1,
              fill: 'red',
              shape: 'circle',
              size: 4,
          },
          style: {
            stroke: 'red',
            strokeWidth: 1,
            fill: 'yellow',
            shape: 'circle',
            size: 2,
          },
        },
        crosshair: {
          style: {
            stroke: 'gray',
            strokeWidth: 1,
          },
        },
      },
  },
  {
    field: 'lineData2',
    title: 'sparkline 2',
    cellType: 'sparkline',
    width:300,
    style:{
      padding:20
    },
    sparklineSpec: {
        type: 'line',
        xField: 'x',
        yField: 'y',
        pointShowRule: 'all',
        smooth: true,
        line: {
          style: {
            stroke: '#2E62F1',
            strokeWidth: 2,
          },
        },
      },
  },
];
const option = {
  records,
  columns,
  defaultRowHeight:60
};
const tableInstance = new VTable.ListTable(document.getElementById(CONTAINER_ID), option);
</br>
结果展示
直接将示例代码中代码粘贴到官网编辑器中即可呈现。
相关文档
迷你图用法教程:https://visactor.io/vtable/guide/cell_type/sparkline
style用法教程:https://visactor.io/vtable/guide/theme_and_style/style
相关api:https://visactor.io/vtable/option/ListTable-columns-sparkline#style.padding
github:https://github.com/VisActor/VTable