如何在 Vue 中使用 VChart
在 Vue 3.x 中使用 VChart,分两种情况:
代码示例
组合式 API
<script setup lang="ts">
import { onMounted, onBeforeUnmount, onUpdated } from "vue";
import { VChart, IChart, ILineChartSpec } from "@visactor/vchart";

interface LineChartProps {
  colors?: string[];
}

const props = defineProps<LineChartProps>();

let chart: IChart;

function parseSpec(chartProps: LineChartProps) {
  const colors = chartProps.colors ?? [
    "#6690F2",
    "#70D6A3",
    "#B4E6E2",
    "#63B5FC",
    "#FF8F62",
    "#FFDC83",
    "#BCC5FD",
    "#A29BFE",
    "#63C4C7",
    "#F68484",
  ];
  return {
    type: "line",
    data: {
      values: [
        { type: "Nail polish", country: "Africa", value: 4229 },
        { type: "Nail polish", country: "EU", value: 4376 },
        { type: "Nail polish", country: "China", value: 3054 },
        { type: "Nail polish", country: "USA", value: 12814 },
        { type: "Eyebrow pencil", country: "Africa", value: 3932 },
        { type: "Eyebrow pencil", country: "EU", value: 3987 },
        { type: "Eyebrow pencil", country: "China", value: 5067 },
        { type: "Eyebrow pencil", country: "USA", value: 13012 },
        { type: "Rouge", country: "Africa", value: 5221 },
        { type: "Rouge", country: "EU", value: 3574 },
        { type: "Rouge", country: "China", value: 7004 },
        { type: "Rouge", country: "USA", value: 11624 },
        { type: "Lipstick", country: "Africa", value: 9256 },
        { type: "Lipstick", country: "EU", value: 4376 },
        { type: "Lipstick", country: "China", value: 9054 },
        { type: "Lipstick", country: "USA", value: 8814 },
        { type: "Eyeshadows", country: "Africa", value: 3308 },
        { type: "Eyeshadows", country: "EU", value: 4572 },
        { type: "Eyeshadows", country: "China", value: 12043 },
        { type: "Eyeshadows", country: "USA", value: 12998 },
        { type: "Eyeliner", country: "Africa", value: 5432 },
        { type: "Eyeliner", country: "EU", value: 3417 },
        { type: "Eyeliner", country: "China", value: 15067 },
        { type: "Eyeliner", country: "USA", value: 12321 },
        { type: "Foundation", country: "Africa", value: 13701 },
        { type: "Foundation", country: "EU", value: 5231 },
        { type: "Foundation", country: "China", value: 10119 },
        { type: "Foundation", country: "USA", value: 10342 },
        { type: "Lip gloss", country: "Africa", value: 4008 },
        { type: "Lip gloss", country: "EU", value: 4572 },
        { type: "Lip gloss", country: "China", value: 12043 },
        { type: "Lip gloss", country: "USA", value: 22998 },
        { type: "Mascara", country: "Africa", value: 18712 },
        { type: "Mascara", country: "EU", value: 6134 },
        { type: "Mascara", country: "China", value: 10419 },
        { type: "Mascara", country: "USA", value: 11261 },
      ],
    },
    color: {
      type: "ordinal",
      domain: [],
      range: colors,
    },
    title: {
      visible: true,
      text: "Stacked line chart",
    },
    stack: true,
    xField: "type",
    yField: "value",
    seriesField: "country",
    legends: [{ visible: true, position: "middle", orient: "bottom" }],
  } as ILineChartSpec;
}

function createOrUpdateChart(chartProps: LineChartProps) {
  const container = document.getElementById("treemap-container");
  if (container && !chart) {
    chart = new VChart(parseSpec(chartProps), {
      dom: container,
    });

    chart.renderSync();
    return true;
  } else if (chart) {
    chart.updateSpec(parseSpec(chartProps));
    chart.renderSync();

    return true;
  }
  return false;
}

onMounted(() => {
  createOrUpdateChart(props);
});

onUpdated(() => {
  createOrUpdateChart(props);
});

onBeforeUnmount(() => {
  if (chart) {
    chart.release();
  }
});
</script>

<template>
  <h1>this is a demo of LineChart</h1>

  <div class="treemap-container" id="treemap-container"></div>
</template>

<style scoped>
.treemap-container {
  width: 100%;
  height: 400px;
}
</style>
选项式 API
<script lang="ts">
import { defineComponent } from "vue";
import { VChart, IBarChartSpec, IChart } from "@visactor/vchart";
import type { PropType } from "vue";

interface BarChartProps {
  colors?: string[];
  data?: any[];
}

export default defineComponent({
  props: {
    colors: Object as PropType<BarChartProps["colors"]>,
    data: Object as PropType<BarChartProps["data"]>,
  },

  setup() {
    let chart: IChart | null = null;
    const parseSpec = (chartProps: BarChartProps) => {
      const colors = chartProps.colors;

      return {
        type: "bar",
        data: [
          {
            id: "barData",
            values: chartProps.data,
          },
        ],
        xField: "name",
        yField: "value",
        color: {
          type: "ordinal",
          domain: [],
          range: colors,
        },
      } as IBarChartSpec;
    };

    const createOrUpdateChart = (chartProps: BarChartProps) => {
      const container = document.getElementById("barchart-container");
      if (container && !chart) {
        chart = new VChart(parseSpec(chartProps), {
          dom: container,
        });

        chart.renderSync();
        return true;
      } else if (chart) {
        chart.updateSpec(parseSpec(chartProps));
        chart.renderSync();

        return true;
      }
      return false;
    };

    const releaseChart = () => {
      if (chart) {
        chart.release();
        chart = null;
      }
    };

    return {
      createOrUpdateChart,
      releaseChart,
    };
  },

  mounted() {
    this.createOrUpdateChart({ colors: this.colors, data: this.data });
  },

  updated() {
    this.createOrUpdateChart({ colors: this.colors, data: this.data });
  },

  beforeUnmount() {
    this.releaseChart();
  },
});
</script>

<template>
  <h1>this is a demo of barchart</h1>

  <div class="barchart-container" id="barchart-container"></div>
</template>

<style scoped>
.barchart-container {
  width: 100%;
  height: 400px;
}
</style>
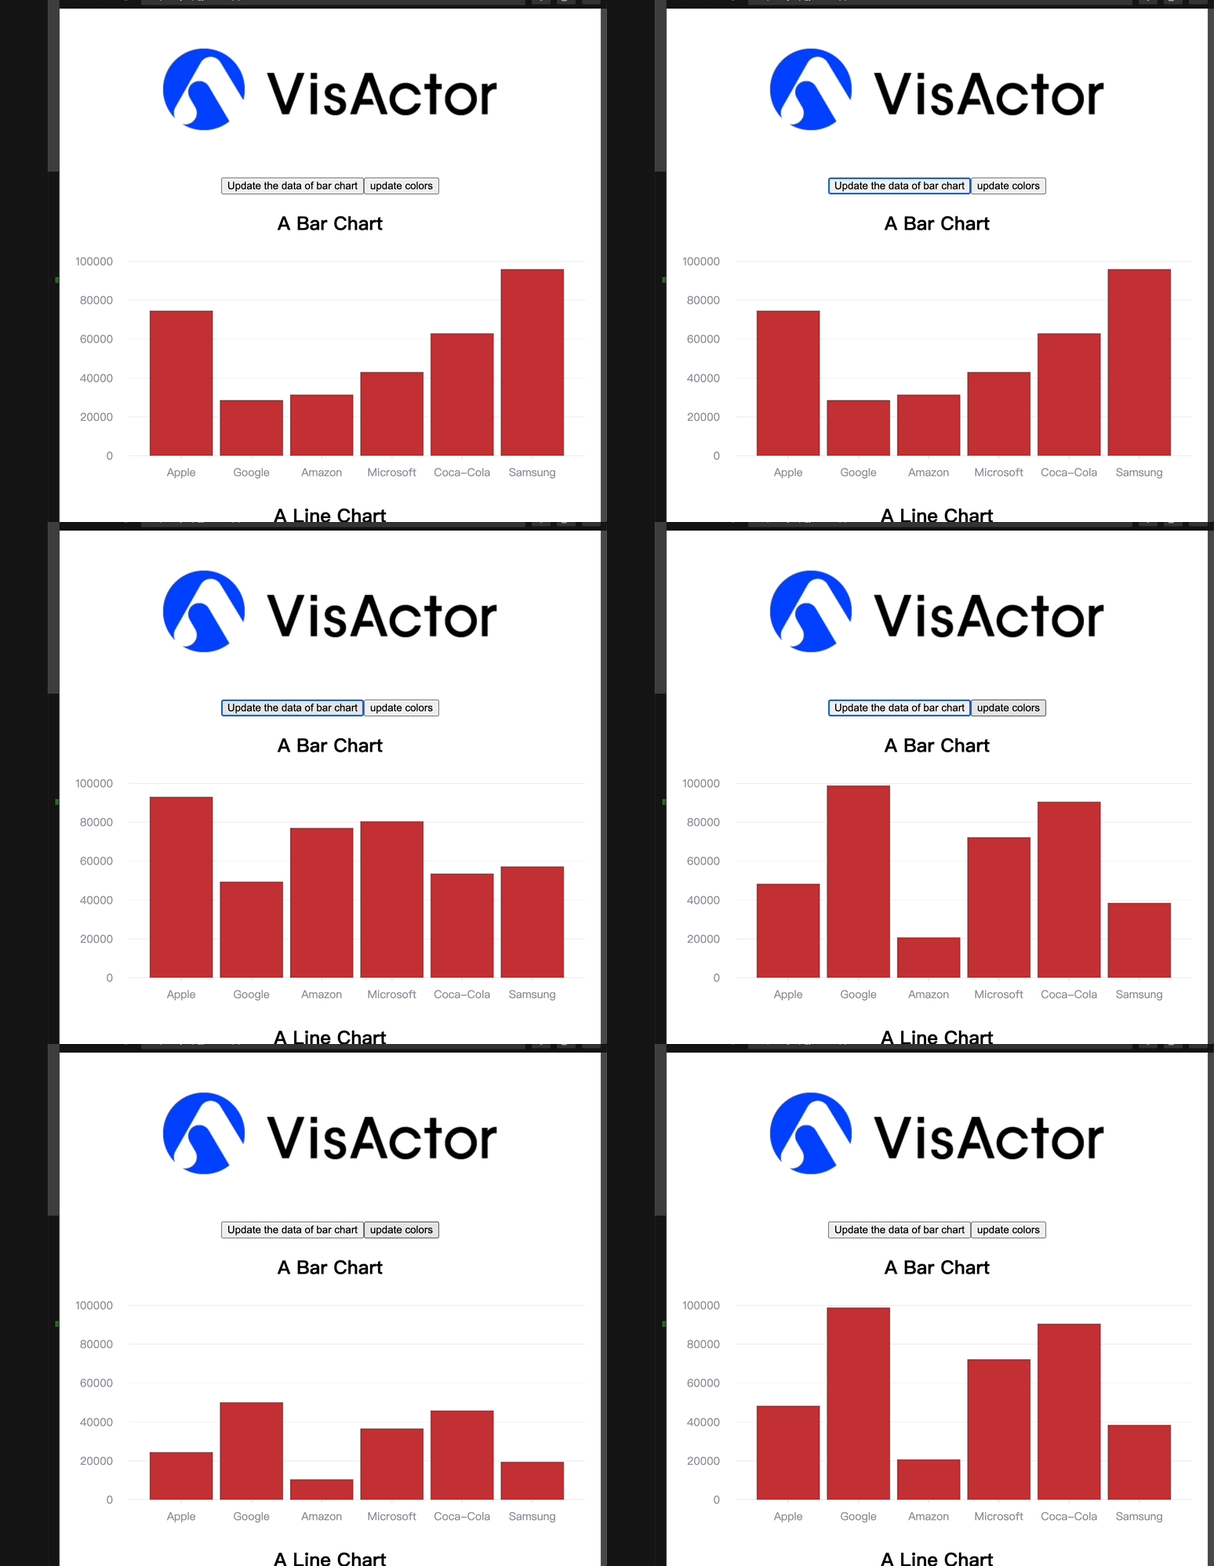
结果展示